- 下载dashboard配置文件
wget https://resource-obsbothk.com/Soft/K8S/prometheus/kube-prometheus-0.13.0.tar.gz
tar -zxvf kube-prometheus-0.13.0.zip
cd kube-prometheus-0.13.0
- 修改镜像源地址
- 如果没有vpn,需要修改对应服务的镜像,manifests/ 文件夹下面所有的deployment yaml 文件
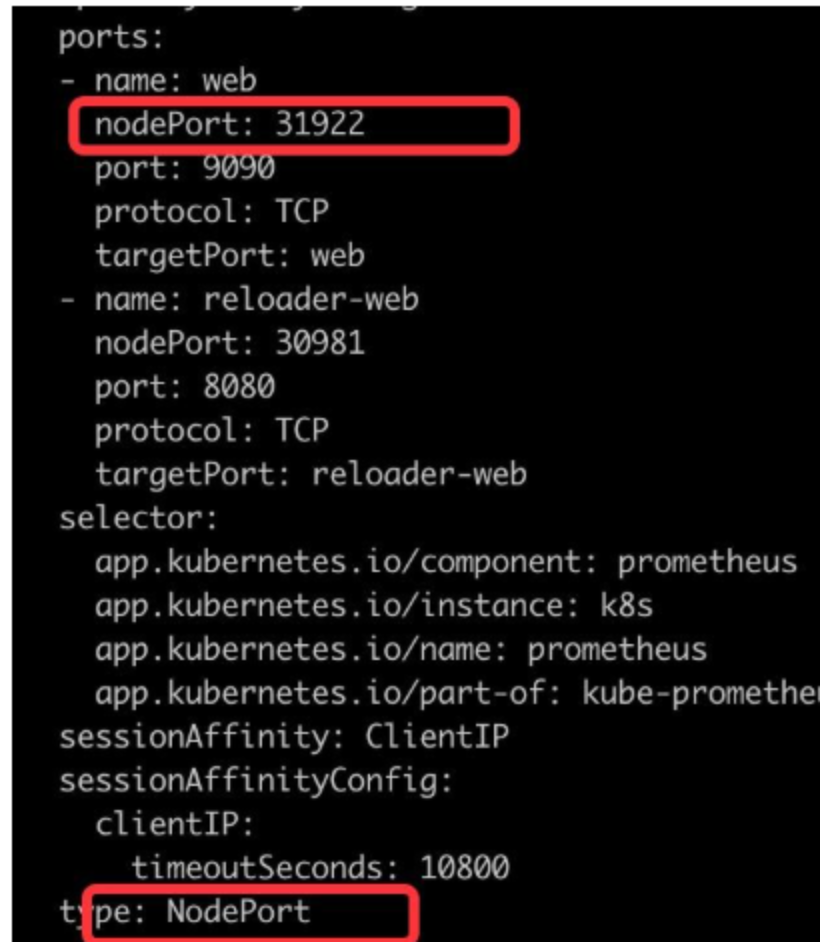
- 修改prometheus service
- manifests/prometheus-service.yaml
# 设置对外访问端口,增加如下两行
type: NodePort
nodePort: 31922
- 修改 Grafana 的 service
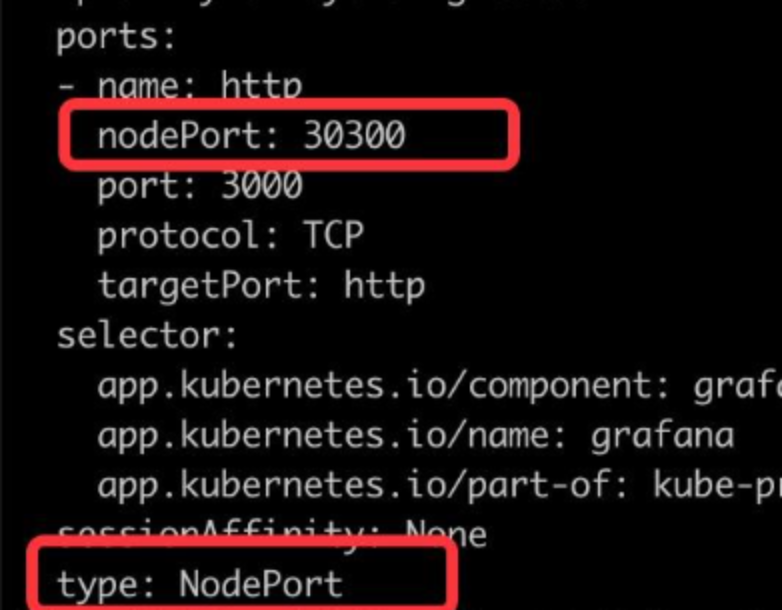
- manifests/grafana-service.yaml
# 设置对外访问端口,增加如下两行
type: NodePort
nodePort: 30300
- 修改 Alertmanager 的 service
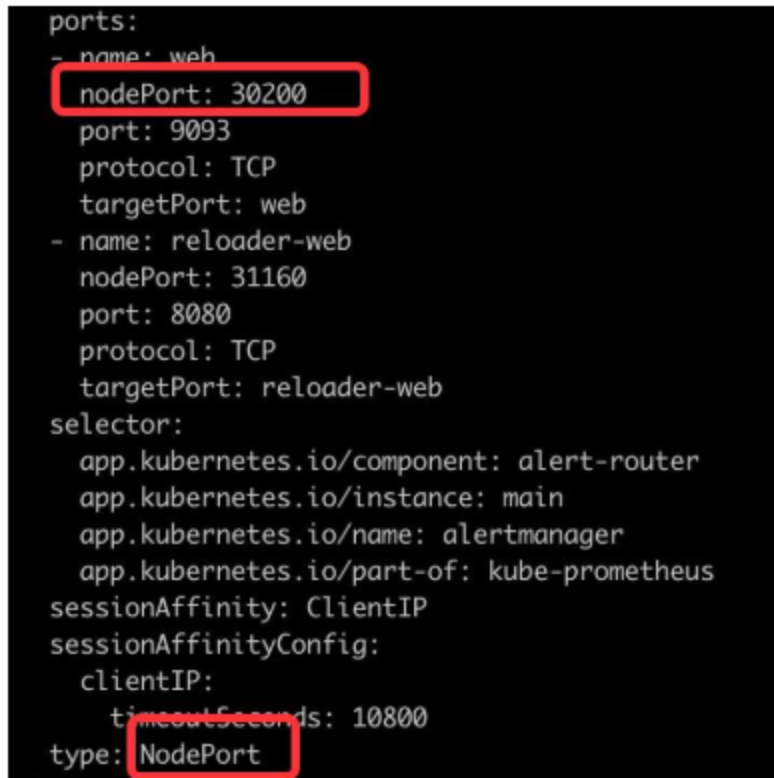
- manifests/alertmanager-service.yaml
# 设置对外访问端口,增加如下两行
type: NodePort
nodePort: 30200
- 安装prometheus
kubectl apply --server-side -f manifests/setup
kubectl apply -f manifests/
- 执行完成以后,访问monitoring 空间,查看部署状态,可以看到启动成功,并且都是高可用部署
kubectl get pods,svc -n monitoring
- 验证Prometheus服务连通性
- Prometheus: IP+31922
- Alertmanager: IP+30200
- Grafana: IP+30300
- 卸载Prometheus
kubectl delete --ignore-not-found=true -f manifests/ -f manifests/setup
Comments & discussion
The first comment in each thread opens a topic. Signed-in readers can keep the conversation going under that topic.
No comments yet. Sign in to start a topic.
Start a new topic
Sign in to start a topic or join the discussion.